Jiri Walek, Co-founder of NEXTEDY and LiteCells by NEXTEDY, leads the product management team, guiding the development of customer requirements and pricing strategies to propel Polarion’s industry-leading solutions.
He collaborates closely with Polarion’s Development and Marketing teams to ensure smooth product launches and strategic go-to-market planning. Additionally, his NEXTEDY has partnered with Taipuva to enhance Polarion’s value for Nordic customers.
The inability to trace risks back to its origins
During Taipuva Polarion Days 2024, Jiri demonstrated NEXTEDY RISKSHEET, an interactive risk analysis editor developed in partnership with Siemens. He mentioned the limitations of current risk record management, which heavily relies on Excel. Excel’s shortcomings include siloed risk management, difficulty in tracing risks back to project requirements, disconnected risk measures from project management, and manual copy-and-paste actions leading to errors and limited data reuse across projects.
– I have a bit of a love-hate relationship with Excel. I use it daily and appreciate its user-friendly interface for processing structural data – it’s perfect for capturing and assessing information efficiently. However, the downside lies in its storage capabilities. I dislike how it integrates with SharePoint and its lack of traceability. I can’t even trace a single line in Excel, which poses a real problem for effective data management.
A blend of two favorites
Jiri continued to explain that while Excel lacks traceability and efficient reuse options, Polarion stands out for its ability to define data models for any discipline, making it a versatile platform for data management.
– If you don’t have the necessary data, there’s nothing to report, right? Simply purchasing a data platform isn’t enough if it’s empty. That’s why at NEXTEDY, we began developing solutions to address this gap. Our goal was to blend the familiar usability of Excel with the powerful capabilities of the Polarion data platform. And today, that’s exactly where we are.
Following this, Jiri showcased the RISKSHEET, focusing on its applicability across industries, from medical to automotive. While unable to disclose specific client configurations, he talked about the fundamental concepts. During the RISKSHEET demonstration Jiri pointed to the user interface.
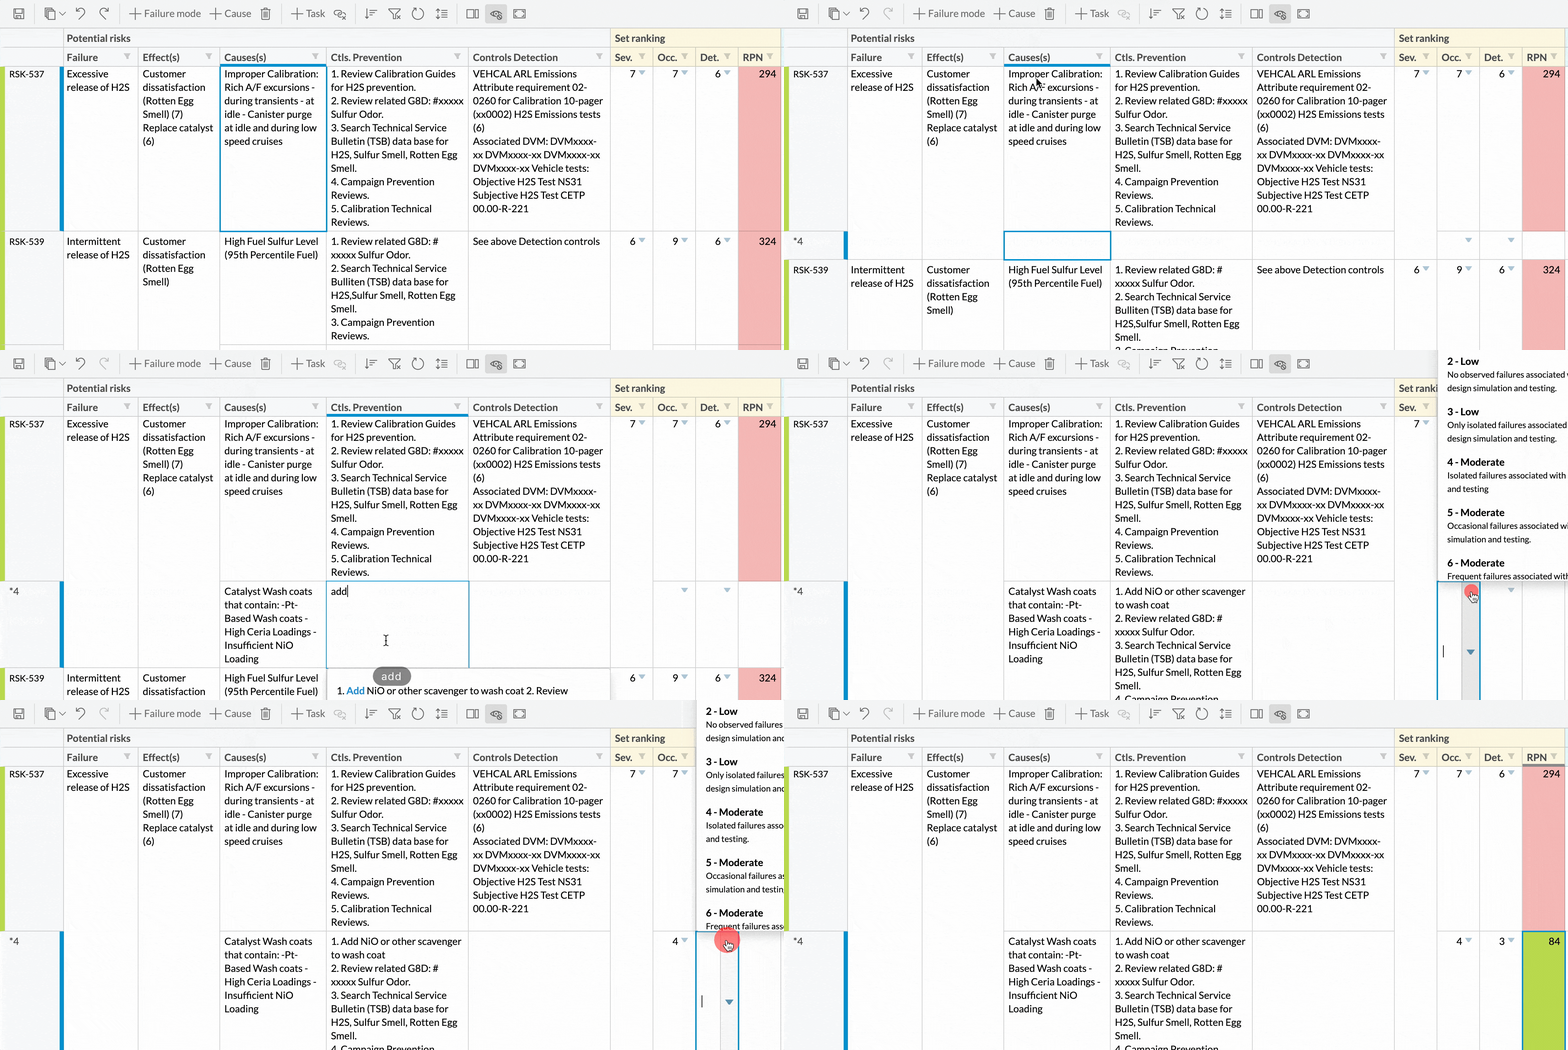
– I’m presenting a tool that helps you organize your risk data for functional safety and cybersecurity. With this tool, you can create a graph of objects, compare data baselines and revisions. Some might argue the user interface is very similar to Excel, and in many ways, they’re right. However, what’s important is that all the necessary data is there. You can filter, copy, and paste, just like in Excel. But what sets it apart is that each line represents a work item. So, for instance, here we have risk records containing vital information like status and classification. Moreover, it’s easy to track changes, such as modifications in fields.

Easy-to-use interface for highly structured data
Jiri underscored the importance of a robust data model, particularly in complex medical processes.
– Let’s simplify this. We’ll call it a risk record from now on, which is better. You might think of it as a model where you have hazards, situations, harm, and probability. Some of you like the idea of building a tree with hazards, situations, harms, and probabilities – a risk tree. But sometimes things are more complex. What you really need to understand is that the risk record provides the context for classification.
Jiri went on to explain that a risk record informs about a specific hazard. Within that context, there’s a situation that can lead to harm. The risk record specifies the probability of the hazard leading to the situation, and then the probability of the situation leading to the harm , and so on.

– Now, imagine trying to create such a graph of objects using only Polarion. It’s not possible. We need a proper interface. So what we do is provide an Excel-like interface. For example, if I want to add another harm I just start typing and select it. Behind the scenes, it creates a risk record connected to the harm and the hazard. This easy-to-use interface allows us to create highly structured data, which is really important.
Transitioning from items to actionable tasks
With just a few clicks, Jiri transformed the configuration from basic to highly structured, demonstrating the tool’s adaptability and efficiency in managing risk data. He noted that while the Polarion model configuration relies on input from the Polarion team, users can easily structure their data into work items and utilize reuse and catalogs effectively.
–This involves constructing catalogs of potential harms at the product line level and specifying risk probabilities. Such functionality promotes secure collaboration and guarantees traceability across all artifacts, improving overall efficiency and reliability.
Jiri extended an invitation to attendees to explore more in-depth functionalities in the upcoming workshop, again underscoring the tool’s versatility and potential for advanced risk management processes.
Taipuva partners with Nextedy to double the value of Polarion
We are proud to announce that Taipuva has formed a partnership with Nextedy that produces applications on top of Polarion ALM platform to boost user effectivenes and simplify user experience. Taipuva will start to provide services, support and software licenses for Nextedy products.